
Power BI · 2025
Sales & Inventory Intelligence System in Power BI
Client · ITC
We built an interactive Power BI intelligence system that unifies sales, customer, branch, and inventory performance—so teams can see growth drivers, benchmark locations, and quantify revenue lost to stock shortages.
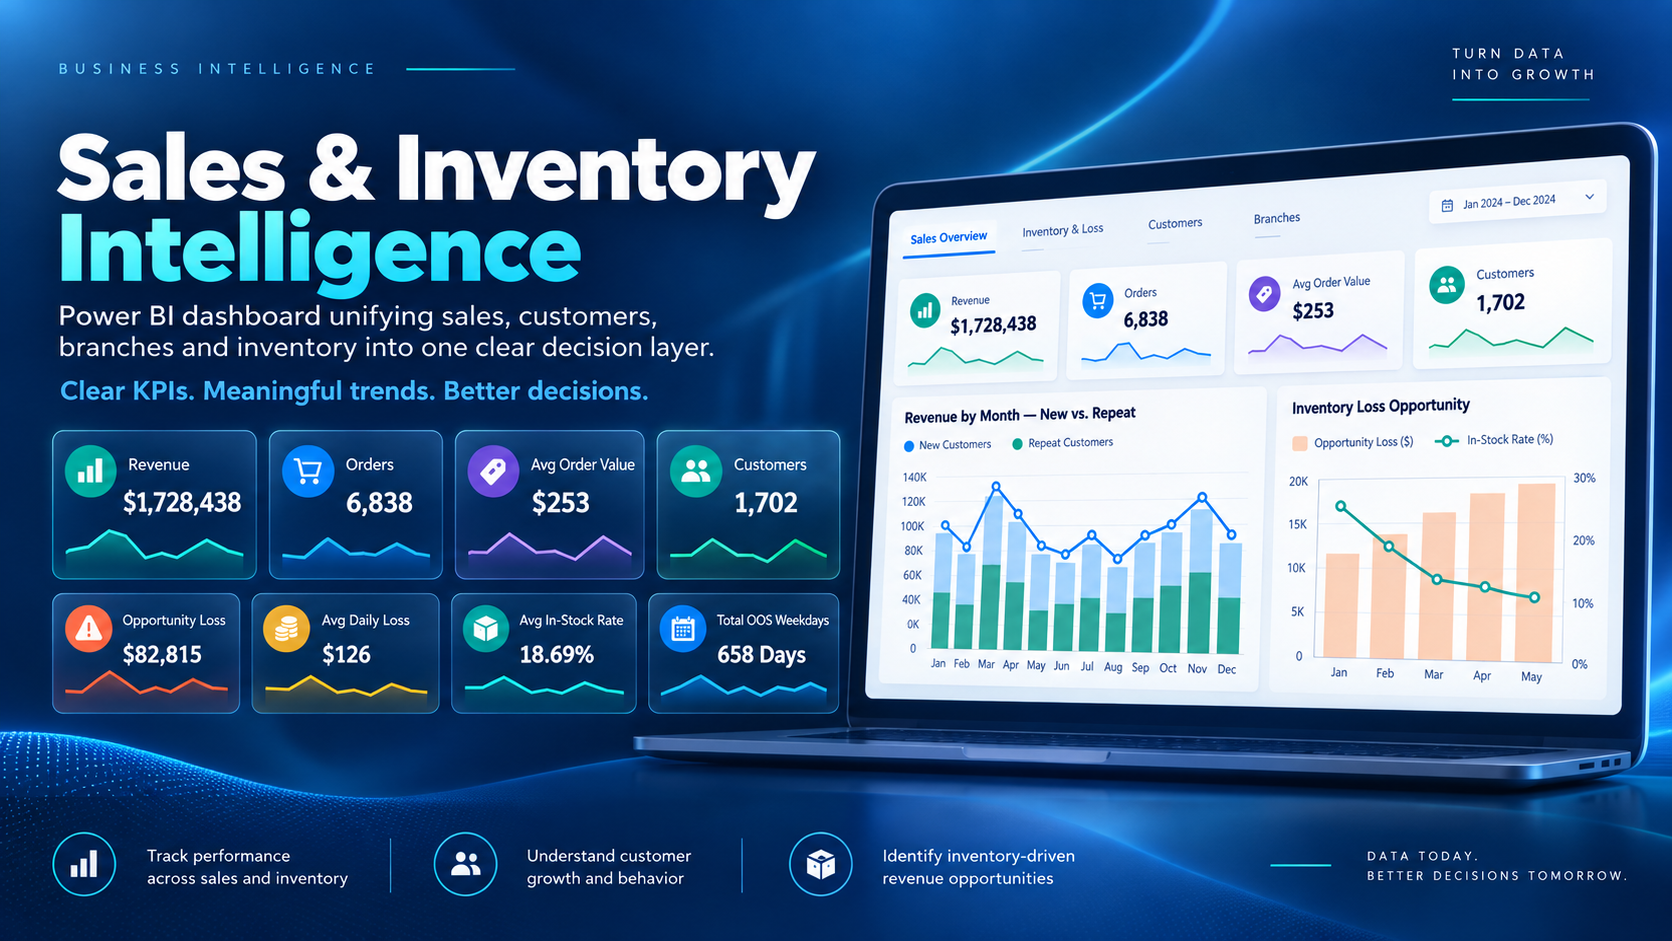
1.72M+
revenue in view
~$83K
lost-sales opportunity surfaced
9
decision areas unified
The challenge
Sales, customer, product, inventory, and branch data produced thousands of records, but raw exports and static reports still left leadership stitching numbers together by hand. The business needed a centralized system to track revenue, orders, customers, and average order value; compare periods; separate new vs. repeat contribution; benchmark branches; evaluate acquisition; identify products hit by low stock; quantify potential revenue lost when items were unavailable; prioritize manufacturers that needed action; and let management explore the data without waiting on a new report. The goal was not more charts—it was a dashboard leadership could act on.
The solution
CodexSmith designed an interactive Power BI business intelligence experience that organizes commercial data around decisions instead of disconnected reports. Executive KPIs, customer and acquisition views, branch rankings, inventory/lost-sales analysis, product prioritization, and a practical manufacturer “who to call” list live in one filtered environment—so teams move from historical review to answering where revenue is growing, which branches need attention, whether new customers are driving growth, which products are leaking revenue through stockouts, and which suppliers to contact first.
Executive sales overview
Leadership gets an immediate snapshot of revenue, orders, average order value, customers, and average daily sales—with historical comparisons and trend views so performance direction is obvious at a glance.
New vs. repeat revenue context
Monthly revenue sits alongside new and repeat customer activity, clarifying whether growth comes from retention, acquisition, spending changes, or specific commercial periods—not only the topline number.
Customer acquisition intelligence
New-customer growth is compared with acquisition cost and advertising performance in the same environment, so commercial and marketing teams can see when spend converts—and when it does not.
Branch & business-unit benchmarking
Revenue, orders, AOV, customers, and average daily sales can be ranked across branches and sub-units, turning the report into a management tool for spotting leaders, laggards, and unusual swings.
Inventory & lost-sales intelligence
Availability is tied to financial impact: opportunity loss, average daily loss, in-stock rate, and out-of-stock exposure—so operations ask how much potential revenue a shortage is costing, not only whether an SKU is empty.
Product & manufacturer action lists
Products and manufacturers are ranked by estimated lost opportunity, creating a clear replenishment and “who to call” workflow for purchasing and supply-chain teams.
Interactive filtering
Users explore by customer class, status, owner, product attributes, date periods, branch/unit, and currency views—moving from executive summary to segments without requesting a separate analyst report.
Key capabilities
| Area | Delivered |
|---|---|
| Sales | Revenue, orders, AOV, and daily sales trends |
| Customers | New vs. repeat behavior and customer growth |
| Marketing | Acquisition performance and spend comparison |
| Branches | Performance benchmarking and ranking |
| Inventory | In-stock analysis and stock-out monitoring |
| Revenue leakage | Estimated lost-sales opportunity |
| Products | High-impact product prioritization |
| Suppliers | Manufacturer-level opportunity analysis |
| Management | Interactive filtering and drill-down analysis |
What we shipped
Screens and walkthrough from the delivered experience.