

CASE STUDY
Healthcare · Revenue Cycle · AI & Data
Revenue cycle answers in seconds, not weeks.
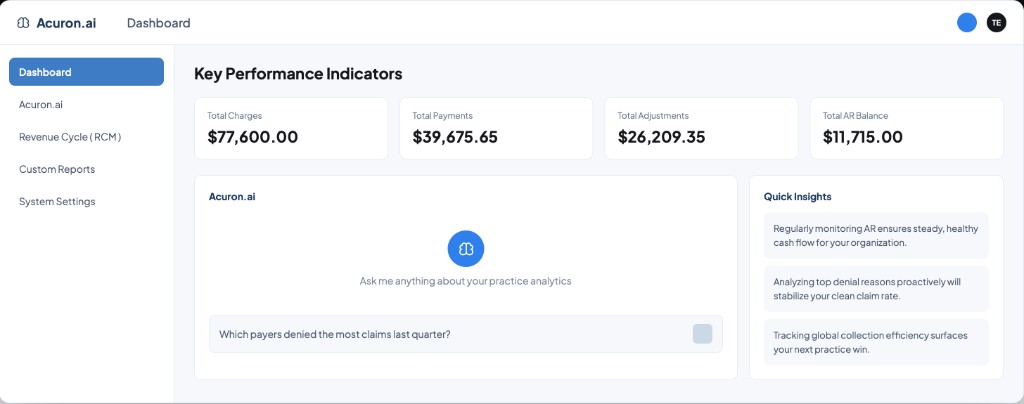
CodexSmith designed and built Acuron.ai — an AI-powered analytics platform that reads live from a healthcare organisation's EHR or practice management system and turns claims, denials and collections data into answers a CFO can ask for in plain English.
Key Performance Indicators
Total Charges
$77,600.00
Total Payments
$39,675.65
Total Adjustments
$26,209.35
Total AR Balance
$11,715.00
Acuron.ai
Ask me anything about your practice analytics
Quick Insights
Regularly monitoring AR ensures steady, healthy cash flow for your organization.
Analyzing top denial reasons proactively will stabilize your clean claim rate.
Tracking global collection efficiency surfaces your next practice win.
- CLIENT
- Acuron AI
- INDUSTRY
- Healthcare RCM
- ENGAGEMENT
- Product build, 0 → 1
- TIMELINE
- 3 weeks to launch
- SCOPE
- Product · Design · Build
The brief
Most billing data never reaches the people who need it — at least not in time to act on it. A denial trend that starts in week one surfaces in a monthly report in week six, by which point the payer has rejected another few hundred claims on the same code.
The problem
The data already exists inside Epic, Cerner and Athena health. The problem is access. A CFO who wants to know why net collection rate slipped has to file a request with an analyst and wait. Traditional RCM reporting is built for retrospective audit, not for the decision someone has to make today.
The mandate
Collapse that gap. A read-only connection to the systems a practice already runs, a normalisation layer that makes KPIs comparable across locations and vendors, and an interface anyone in finance can use without learning SQL — shipped fast enough to matter.
Where complexity was real
Healthcare finance software is held to a standard most SaaS never meets. It touches protected health information, plugs into systems no vendor is allowed to disrupt, and its users are personally accountable for the numbers it produces.
PHI, handled properly
Every decision assumed protected health information. Encryption, tenant isolation, role-based access and audit logging were foundations — not a hardening sprint bolted on before the first enterprise security review.
Six schemas, one KPI
Epic, Cerner, Athena health, NextGen, eClinicalWorks and Allscripts each model claims differently. Net collection rate has to mean exactly the same thing in all six before a single benchmark chart can be trusted.
AI a CFO can defend
A natural-language answer is worthless if the finance lead can't trace it. Every response resolves to a query, a filter set and a row count the user can open and inspect before taking it to a board meeting.
Zero workflow disruption
Read-only access, no replacement of the billing system, no retraining of staff. If onboarding cost a practice a week of downtime, nobody would buy it — so setup had to be measured in business days.
What we built
Six capabilities that make revenue cycle data accessible, understandable and actionable for every role — from the billing coordinator to the CFO.
Real-Time Dashboards
Always-on analytics for collections, net collection rate, days in AR and payer performance.
Conversational Analytics
Ask in plain English, get back charts, tables and the context needed to read them.
Denial Pattern Detection
Top denial reasons with payer-level segmentation and alerts, caught before they compound.
Revenue Leakage Detection
Charge capture patterns and payment variance against expected rates, monitored continuously.
Provider Benchmarking
Normalised metrics comparing productivity across providers, specialties and locations.
AR Optimisation
AR aging and stuck-claim analysis with configurable bucket definitions per organisation.
Inside the product
Three screens that carry most of the product's weight.
Key Performance Indicators
Total Charges
$77,600.00
▲ 0.00%
Total Payments
$39,675.65
▲ 0.00%
Total Adjustments
$26,209.35
▲ 0.00%
Total AR Balance
$11,715.00
▲ 0.00%
SCREEN 01
The dashboard a CFO opens first
Charges, payments, adjustments and AR balance sit above the fold, trended against the prior period. Everything else is drill-down. We deliberately resisted showing every available metric — the executive view answers one question, is the month on track, and then gets out of the way.
Acuron.ai
Ask me anything about your practice analytics
Quick Insights
Regularly monitoring AR ensures a steady, healthy cash flow.
Reviewing upcoming patient load optimises daily efficiency.
Top denial reasons stabilise your clean claim rate.
SCREEN 02
Ask it like you'd ask an analyst
Which payers denied the most claims last quarter, and why? The assistant returns a structured RCM answer with the chart, the table and a note on how the figure was calculated. Alongside it, Quick Insights push proactive observations the user never thought to ask for.
AR Aging
Currency: USD
Insurance Aging
SCREEN 03
Where the money is stuck
Insurance and patient aging split side by side, with bucket definitions configurable per organisation — because a 121–180 spike means something different to a three-site clinic than to a hospital system. The shape of this chart is usually the first thing that starts a conversation with a payer.
The pipeline
Four stages between a practice management system and an answer on screen. The hard engineering is in the middle two.
- 01
Data Integration
A secure, read-only connection to the customer's existing EHR or PMS. No migration, no write access, no change to how the billing team works.
- 02
Ingestion
Near real-time sync of charge, claim, payment and denial data, with historical backfill and incremental updates thereafter.
- 03
Normalisation
A canonical RCM schema reconciling six vendors' data models into standardised KPIs — the layer that makes cross-location benchmarking possible at all.
- 04
Intelligence Layer
KPI computation, anomaly detection and denial pattern analysis — plus the natural language layer that sits on top of it.
Six connectors, shipped
Each handles its vendor's own claim model, and multiple sources can run at once for organisations with a mixed estate.
Epic
Real-time charge & claim sync
Cerner
Revenue cycle ingestion
Athena Health
Ambulatory billing data
NextGen
Multi-location analytics
eClinicalWorks
Billing & claims ingestion
Allscripts
Unified multi-source view
UNDER THE HOOD
FRONTEND
[Next.js + TypeScript]
BACKEND
[Node.js / FastAPI]
DATA
[PostgreSQL · warehouse]
AI LAYER
[LLM + text-to-SQL]
INFRASTRUCTURE
[AWS · Docker · CI/CD]
The outcome
Acuron went live with six EHR and PMS integrations and an onboarding path measured in business days — from first workshop to production in three weeks.
2
EHR and PMS systems integrated at launch
6
weeks to onboard a new customer — not months
3
weeks from first workshop to production launch
“CodexSmith built exactly what we scoped, on time, and asked the right questions before writing a line of code. Rare combination.”
More case studies
POWER BI
Sales & Inventory Intelligence System in Power BI
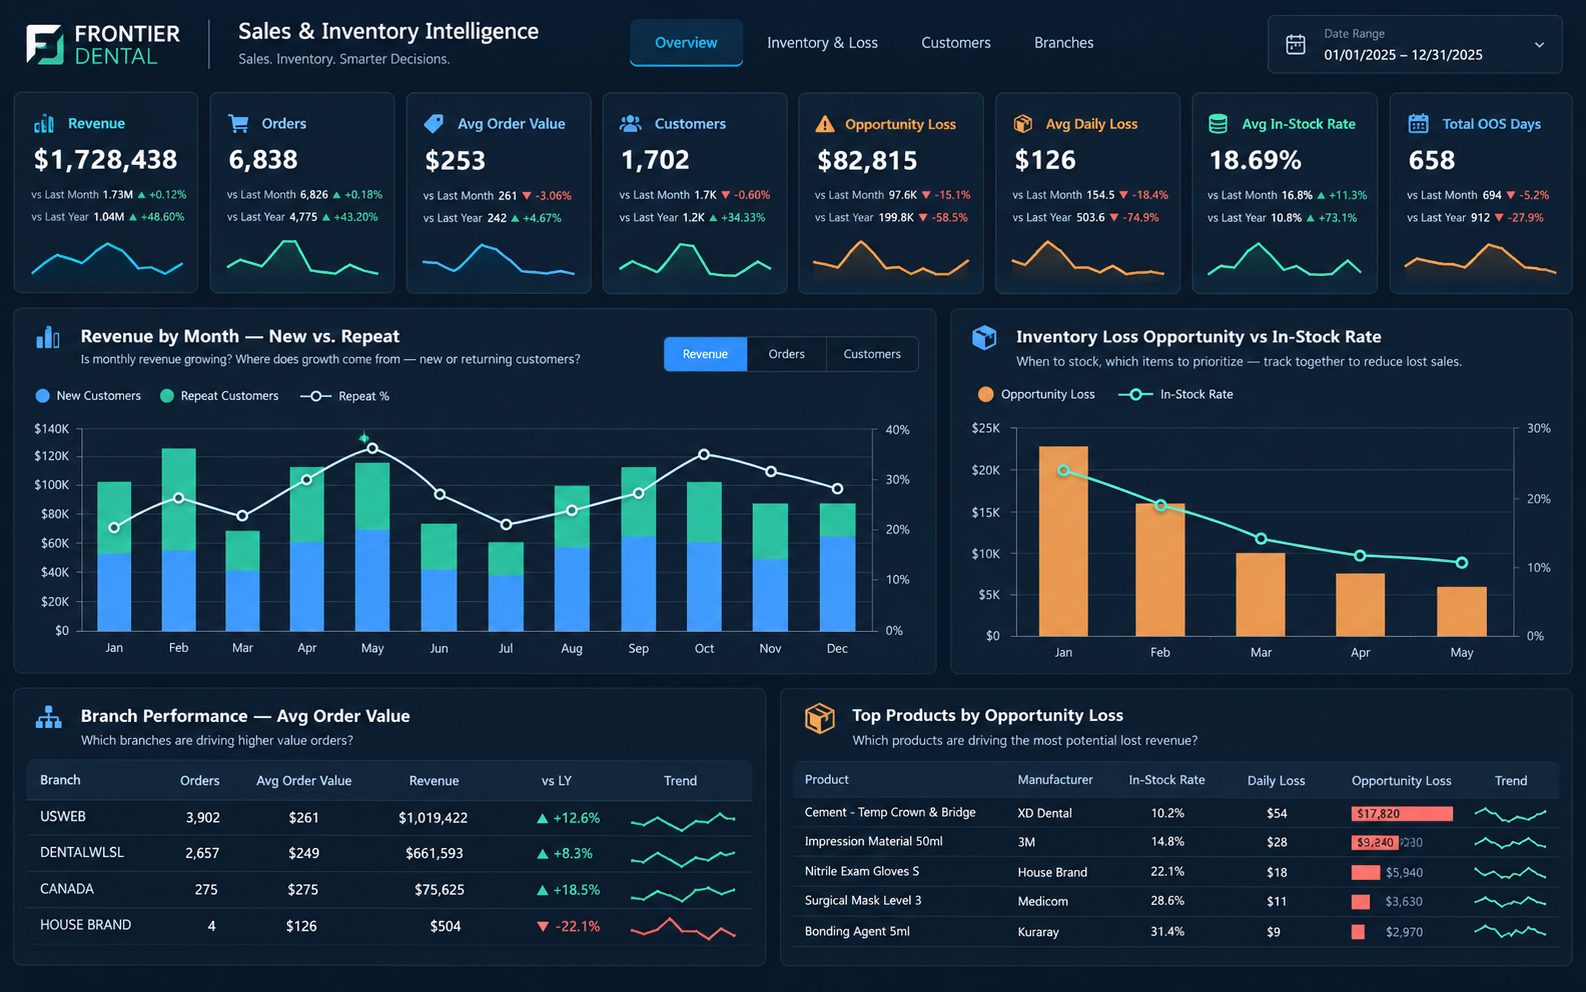
We built an interactive Power BI intelligence system that unifies sales, customer, branch, and inventory performance—so teams can see growth drivers, benchmark locations, and quantify revenue lost to stock shortages.
HEALTHCARE RCM
Acuron.ai — Revenue cycle answers in seconds
CodexSmith designed and built Acuron.ai — an AI-powered analytics platform that reads live from a healthcare organisation's EHR or practice management system and turns claims, denials and collections data into answers a CFO can ask for in plain English.
Your product, where complexity is real.
Tell us what you're building and we'll come back with a scope, a timeline and a number.